Registration is open for lifetime access
Preparation of Rainfall Indices in Excel and ArcGIS
Popular 10 rainfall-based indices shown in this course such as MFI, R factor, RDI, PCI, RSI, RAI, RVI, CVR, PNPI
About the Course
In this course, you can learn the complete process of how downloading rainfall data, processing data, converting daily to monthly rainfall data, step by step guide of 10 important rainfall indices such as long term average annual rainfall (High resolution 0.04 X 0.04), Rainfall Intensity Index (by MFI), Rainfall Erosivity factor (R), Rainfall deviation Index ( RDI), Precipitation concentration Index (PCI), Rainfall seasonality Index (RSI), Rainfall Anomaly Index (RAI), Rainfall variability index (RVI), Co-efficient of variability of Rainfall (CVR), Percent of normal precipitation index (PNPI) in excel and produced map for MCDM models using ArcGIS.

Course Content
- 1. Introduction
- 2. Data sources
- 3. Global Weather data
- 4. IMD rainfall data download
- 1. Long term average annual rainfall
- 2. Rainfall intensity Index by Modified Fournier Index (MFI)
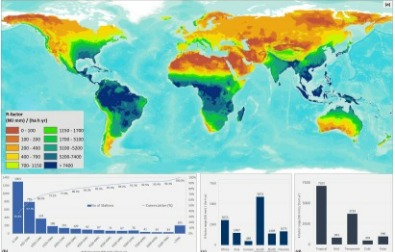
- 3. Rainfall Erosivity factor (R)
- 4. Rainfall Deviation Index (RDI)
- 5. Precipitation concentration Index (PCI)
- 1. Layer preparation in ArcMap
- 2. Final Map