Registration is open for Online workshop (Workshop will Start on 22nd March 2024)
Statistical Data Analysis and Visualization With R Programming
From Basics to Advanced Analytics
Unlock the full potential of your data with our comprehensive workshop on Statistical Data Analysis and Visualization using R Programming, where you'll journey from foundational techniques to mastering advanced analytics and visualization strategies.
New Launch Offer
₹ 4,999 or $65
Receive a lifetime subscription to the course materials, allowing you to revisit and refresh your knowledge at any time.
Gain a solid understanding of R programming, starting from the basics and progressing to advanced data analysis techniques.
Benefit from the continuous support of our expert instructors, who will guide you through the process of statistical analysis and visualization.
Course Completion Certificate by Advances in Geographical Research
The Key to Unlocking High-Impact Research Publications
If you answered yes to any or all of the above, this program is for you!
IT DOESN'T HAVE TO BE THIS WAY
Eliminate the uncertainty and allow expert instructors to guide you through the intricacies of R programming for data analysis and visualization. They'll equip you with the essential tools and techniques needed to elevate your research, ensuring you know how to apply these advanced skills to achieve publication success in high-impact journals.PROGRAM DETAILS
- Module 01: Introduction to R Programming
- The Importance of Statistics and Data Analysis
- Future of Statistics
- Interdisciplinary Applications
- Features of R programming
- Statistical Exploration and Visualization
- Comparison between R and Python
- R Advantages and Disadvantages
- Career Opportunities
- Module 02: R Programming for Data Science
- Overview
to R
- History, purpose and Overview of R.
- Installing R and RStudio.
- Overview of the RStudio layout.
- Exploring the console, script editor, environment, and plots panel.
- Basic Operations:
- Operators (Arithmetic Operators, Relational Operators, Logical Operators, Assignment Operators, Miscellaneous Operators)
- Variable Assignment (Data Type of a Variable, Finding Variables, Deleting Variables)
- Data types (Integer, numeric, character, logical, Complex)
- Vectors (Vector Creation, Accessing Vector Elements, Vector Manipulation)
- Matrices and Arrays (Creating matrices and arrays, Matrix Computations)
- Lists (Creating and working with lists, Accessing list elements, Merging Lists, Converting List to Vector)
- Data Frames (Extract Data from Data Frame, Expand Data Frame)
- Factors (Factors in Data Frame, Changing the Order of Levels, Generating Factor Levels)
- Data Reshaping (Joining Columns and Rows in a Data Frame, Merging Data Frames, Melting and Casting, Melt the Data, Cast the Molten Data)
- Decision Making (If Statement, If...Else Statement, The if...else if...else Statement, Switch Statement)
- Loops (Repeat Loop, While Loop, For Loop, Loop Control Statements, Break Statement, Next Statement)
- Module 03: Data Input and Visualization
- Data Import and Export:
- Reading and writing data from/to various formats (CSV, Excel, Web Data etc.)
- Data Cleaning and Transformation:
- Dealing with missing values;
- Removing duplicates;
- Transforming and recoding variable names
- Basic Plotting:
- Creating scatter plots, bar plots, pie plots, histograms, and line plots using base R
- Adding titles, labels, and legends.
- Introduction to Packages:
- Installing and loading packages
- Utilizing popular packages (ggplot2, tydiverse, dplyr, tidyr) for data manipulation.
- Module 04: Introduction to Descriptive Statistics
- Measures of central tendency:
- Mean
- Median
- Mode
- Measures of dispersion:
- Range
- Variance
- Standard deviation
- Module 05: Statistics with Correlation and Regression
- Regression Analysis
- Linear
- Multiple
- Logistic
- Poisson
- Normal Distribution
- ANOVA (Analysis of Variance) Test (One Way, Two Way)
- Covariance and Correlation
- Skewness and Kurtosis
- Hypothesis Testing
- One Sample T-Testing
- Two Sample T-Testing
- Paired Sample T-test
- Covariance Matrix
- Pearson Correlation
- Normal Probability Plot
- Quantile-Quantile (Q-Q) plots
- Module 06: Advance and Attractive Presentation of Data (ggplo2)
- Introduction with ggplot2 package
- Grammar of ggplot2
- Scatter plots
- Box plots
- Dot plot
- Violin plots
- Heat map
- Histogram
- Density plots
- Module 07: Time Series Analysis
- Understanding time series data and its components.
- Decomposition
of time series: trend, seasonality, random and observed
Autocorrelation Function (ACF) - Partial Autocorrelation Function (PACF)
- Forecasting techniques
- Moving averages
- Exponential smoothing and
- ARIMA Model
-
Module 08: Machine Learning Model
- Decision Tree
- Random Forest
- K-Means Clustering
- Evaluation Matrix (Precision, Recall and F1-Score using R)
- BONUS
- Multivariate analysis techniques
- PCA (Principal Component Analysis)
- Factor
analysis.
- Taylor Diagram
WHO IS THIS COURSE FOR?
The Data Science course is for you if...
Aspiring data scientists and analysts who want to specialize in statistical data analysis and visualization techniques using R.
Researchers and academics in various fields looking to enhance their data interpretation skills for more impactful publications.
Professionals in business, healthcare, finance, and other sectors seeking to leverage data-driven insights for better decision-making.
Students in statistics, computer science, engineering, and related disciplines aiming to build a strong foundation in R programming for their future careers.
By enrolling in this course, you're not just learning to analyze and visualize data; you're preparing to become an influential voice in your field, capable of turning complex datasets into clear, actionable insights. Whether your goal is to drive research, influence business strategies, or contribute to policy formulation, this course equips you with the skills needed to make a significant impact. Join us on this journey to mastering R programming and elevate your data analysis capabilities to new heights.
Gain Immediate Entry to Advanced R Programming: Master Data Analysis and Visualization for Publication Excellence Today!
Expertly Designed R Programming Modules & Project Kits That Elevate Your Data Analysis Skills to Combat Publication Challenges & Enhance Research Impact

Course Materials

Easy To Follow Course Videos

Downloadable PDFs For All Modules
Today Just: INR 4,999/- or $65
YES! Count Me In for the Live Workshop and Lifetime Access to Recorded Videos on 'Advanced R Programming: Mastering Data Analysis and Visualization'
CERTIFIED RESEARCH SKILL AT ADVANCES IN GEOGRAPHICAL RESEARCH (AIGR)!
Upon completing our "Statistical Data Analysis and Visualization with R Programming: From Basics to Advanced Analytics" course, participants will be awarded a certificate of completion, marking their proficiency in leveraging R for comprehensive data analysis and visualization. This course is your stepping stone to mastering the intricacies of R programming, enabling you to perform robust statistical analyses and create impactful visualizations. Whether your goal is to inform strategic decisions, contribute to research, or publish your findings, the skills you acquire will be invaluable.
Enroll today and embark on a transformative journey that will amplify your analytical capabilities, allowing you to uncover actionable insights from vast datasets with precision and creativity. With lifetime access to the course materials, you can continually refine your skills and stay at the forefront of data analysis techniques.
Don't miss this opportunity to enhance your career and contribute to data-driven solutions in your field. Sign up now and secure your place in a community of forward-thinking analysts committed to excellence in data science!
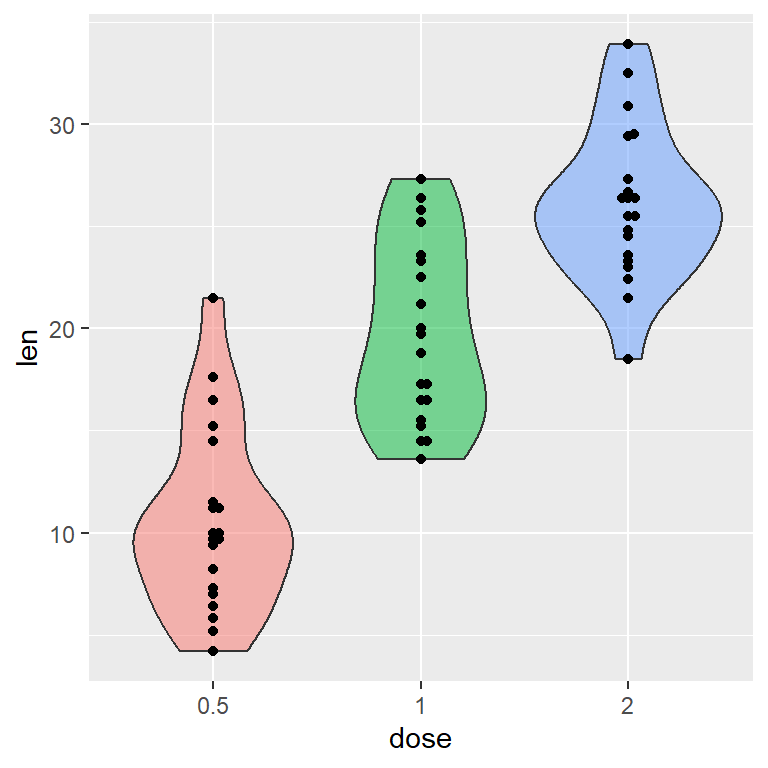
GLIMPSE OF THE COURSE
Statistical Data Analysis and Visualization with R Programming: From Basics to Advanced Analytics" offers a comprehensive journey into the world of R programming, designed to equip learners with the skills needed to perform sophisticated data analysis and create impactful visualizations. This course is your gateway to understanding and applying statistical methods, machine learning techniques, and data visualization principles using R, setting a solid foundation for your career in data science or enhancing your current professional skill set. With hands-on experience, personalized learning support, and access to a network of professionals, you're set to embark on a path of continuous growth and opportunity in the field of data analysis.
Hands-on RStudio Experience: Practical training in using RStudio for advanced data analysis and visualization projects.
Machine Learning Mastery: Learn to apply machine learning techniques within R to solve complex data challenges.
Live Interaction: Direct communication with instructors via live WhatsApp chatting for instant support.
Lifetime Access: Permanent subscription to course materials, allowing for anytime, anywhere learning.
How does this work?
Begin by accessing the exclusive course videos, available solely to registered participants, introducing you to the essentials of R programming for statistical data analysis and visualization.
Dive into the core principles of data manipulation, statistical analysis, and creating compelling visualizations, empowering you to tackle real-world data challenges effectively.
Engage with hands-on projects and tutorials, meticulously crafted to reinforce your learning and apply new skills in practical scenarios, following the expert strategies laid out by leading data scientists.
Successfully complete the course modules and assessments over the specified period to earn your official course completion certificate, marking your proficiency in advanced R programming and data analysis techniques.
Meet Your Instructor
Mr. Sujit Kumar Roy
Mr. Sujit Kumar Roy currently serves as the Assistant Manager (Environment) within the Research and Development Department at Gazi Renewable Energy Ltd., a prominent entity focused on advancing renewable energy solutions. With over five years of professional experience, Mr. Roy has established himself as an expert in Environmental Impact Assessment (EIA), Remote Sensing (RS), and Geographic Information Systems (GIS), with proficiency in software such as ArcGIS, QGIS, Google Earth Engine (GEE), SPSS, R programming, Python, and MATLAB. His contributions have been instrumental in various national and international projects, showcasing his versatility across roles such as GIS Analyst at Plan Plus Limited (PPL), Research Assistant at the Institute of Water and Flood Management (IWFM) at BUET, Research Fellow at RAiN Forum, and Junior Environmental Expert at Plan Plus Limited (PPL).Mr. Roy's academic achievements include completing his postgraduate studies in Water Resources Development at IWFM, BUET, Bangladesh, furthering his expertise built upon a Bachelor’s degree in Environmental Science and Disaster Management from Noakhali Science and Technology University (NSTU). As a dedicated independent researcher, Mr. Roy has published numerous scientific articles in globally recognized journals. His research interests are diverse, covering RS and GIS applications, hydrology, time series analysis, natural hazards, coastal zone management, and leveraging machine learning and deep learning within environmental studies.
Google Scholar: https://scholar.google.com/citations?hl=en&user=5lmC1-IAAAAJ
FAQ
Is prior R programming experience required?
No, this course is designed for all levels, including beginners.
What do I need to start the course?
A computer with internet access and the latest versions of R and RStudio installed.
Course duration and flexibility?
The course is self-paced, with access to materials allowing you to learn according to your own schedule.
Do I have lifetime access to course materials?
Yes, participants will have lifetime access to all course materials for continuous learning.
Are there live sessions?
The course includes both pre-recorded lectures and live sessions for interactive learning.
What if I need help during the course?
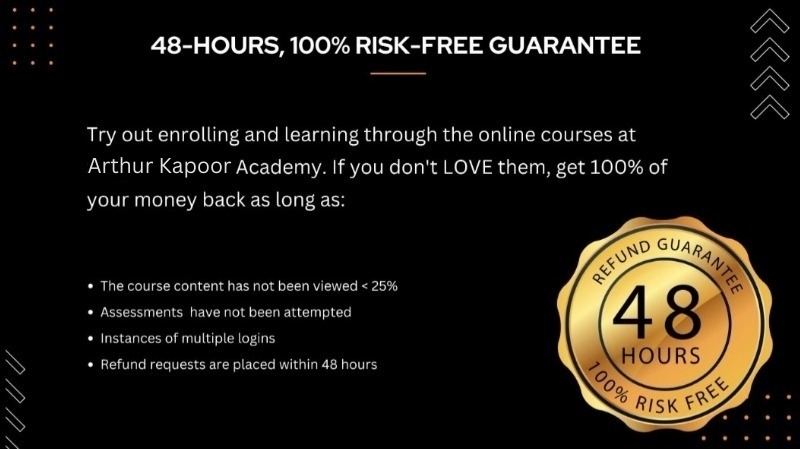
Support is available through forums, email, and during live sessions for immediate assistance.Refund Policy
48-Hours, 100% Risk-Free Guarantee
GET IN TOUCH:
OUR COURSES
1. Flood Hazards,
Vulnerability and Risk Assessment using Analytical Hierarchy Process in ArcGIS
2. Groundwater
potentiality and stress zonation using TOPSIS, VIKOR and EDAS models in ArcGIS
3. An Integrated
MCDM approach for Drought Vulnerability Assessment in ArcGIS
4. An Ensemble of
Evidence Belief Function (EBF) with FR for GIS-based landslide prediction in
ArcGIS
5. Hydro-morphometric
characteristics of the drainage basin in ArcGIS
6. Preparation of
rainfall indices using ArcGIS
7. LULC Mapping
using Conventional and machine learning approaches and its prediction by CA
Markov
8. Mastering
ArcGIS: From Beginner to Expert
9. Google Earth
Engine (GEE) for Remote Sensing & GIS Analysis: Beginners to Advanced
10. Machine Learning
(ML) for Landslide Prediction Mapping with RStudio and ArcGIS
11. Practical
Training in Univariate and Bivariate Analysis with SPSS
12. Innovative Trend
Analysis (ITA) for Environmental Monitoring: Using Excel, R, and ArcGIS